⚠️ Notice to Users
The Getting Started documentation and associated Tutorials for this SyncroSim package currently reflects information for SyncroSim version 2. We are in the process of updating these pages to ensure compatibility with SyncroSim version 3. In the meantime, please note that some instructions, references, and/or images may not fully align with the latest version of SyncroSim. We appreciate your patience as we work to provide updated resources.
Getting started with DG-Sim
Quickstart Tutorial
This quickstart tutorial will introduce you to basics of working with DG-Sim. The steps include:
- Installing DG-Sim
- Creating a new DG-Sim Library
- Viewing model inputs
- Running the model
- Analyzing the results
Step 1: Install DG-Sim
DG-Sim is a Package within the SyncroSim simulation modeling framework; as such, running DG-Sim requires that the SyncroSim software be installed on your computer. To install DG-Sim, follow the instructions under How to Install
Step 2: Create a new DG-Sim Library
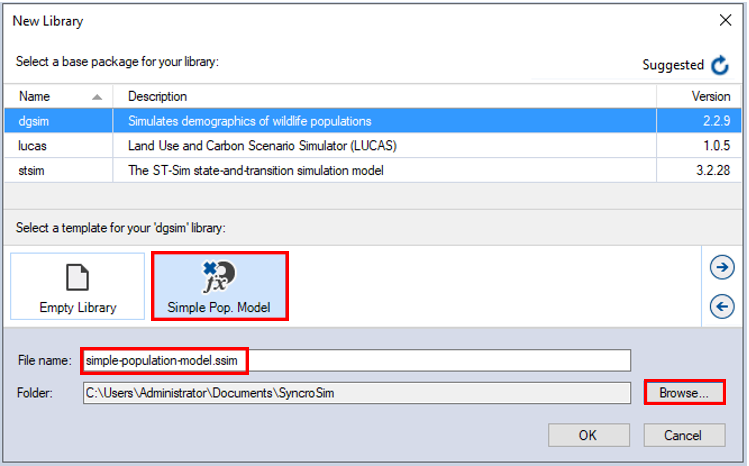
Having installed the DG-Sim Package, you are now ready to create your first SyncroSim Library. A Library is a file (with extension .ssim) that contains all of your model inputs and outputs. Note that the format of each Library is specific to the Package for which it was initially created. To create a new Library, choose New Library… from the File menu.
In this window:
- Select the row for the dgsim - Simulates demographics of wildlife populations. Note that as you select a row, the list of Templates available and suggested File name for that base package are updated.
- Select the Simple Pop. Model Template as shown above.
- Optionally type in a new File name for the Library (or accept the default); you can also change the Folder containing the file using the Browse… button.
When you are ready to create the Library file, click OK. A new Library will be created and loaded into the Library Explorer.
Step 3: Review the model inputs
The contents of your newly created Library are now displayed in the Library Explorer. Model inputs in SyncroSim are organized into Scenarios, where each Scenario consists of a suite of values, one for each of the Model’s required inputs.
Note: Because you chose the Simple Pop. Model Template when you created your Library, your Library already contains two pre-configured Scenarios with model inputs. These inputs were filled in and distributed as a sample with the package to help you get started quickly, and represent hypothetical management Scenarios: one a Baseline, and another at 4x Harvest.
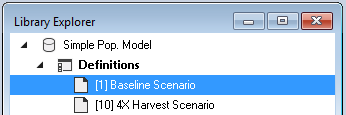
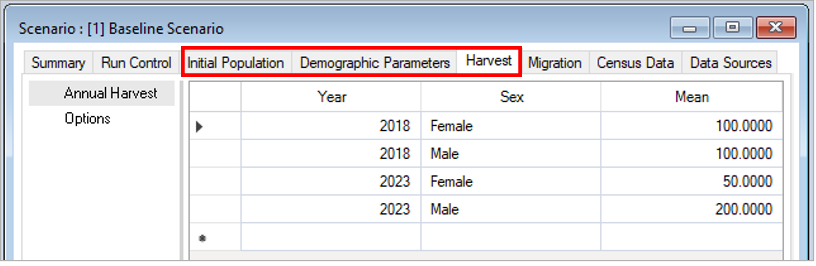
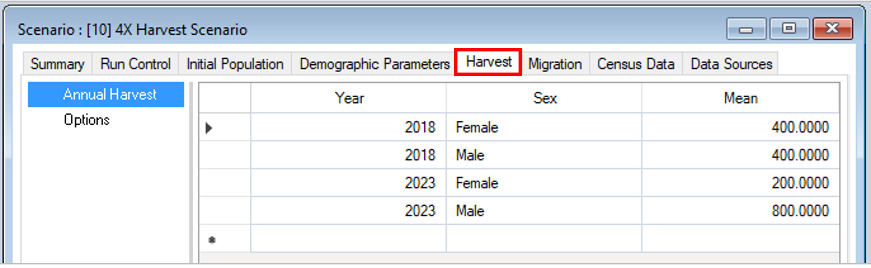
As shown in the image above, the Library you have just opened contains two Scenarios, each with a unique ID. The first of these scenarios (with ID=1, as shown above in square brackets) is named Baseline Scenario; this scenario contains a suite of model inputs corresponding to a hypothetical baseline harvest plan. The second scenario (with ID=10 and named 4x Harvest Scenario) contains model inputs corresponding to an alternative plan where harvest targets are 4 times greater than those of the Baseline Scenario.
To view the details of the first of these Scenarios:
- Select the scenario named Baseline Scenario in the Library Explorer.
- Right-click and choose Properties from the context menu to view the details of the Scenario.
This opens the Scenario Properties window.
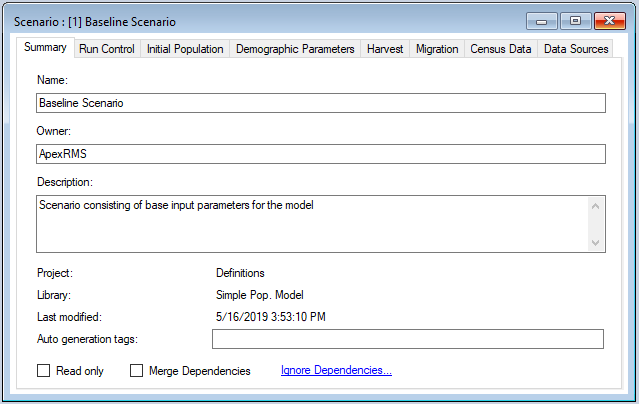
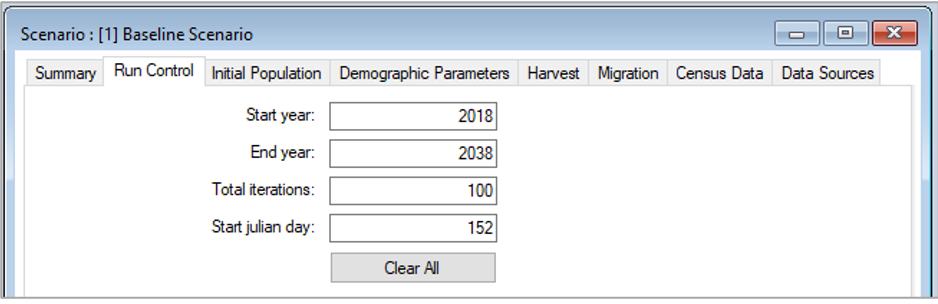
The first tab in this window, called Summary, displays some generic information for the Scenario. The second tab, Run Control, contains parameters for running a model simulation. In this example, the Scenario will run for 20 years, starting in the year 2018 on Julian day 152 (June 1st), and repeated for 100 Monte Carlo iterations. The Start Julian day represents the date at which the simulation begins each year, as well as the parturition (i.e. birth) date for females, and the date at which model output is reported.
Click on the Initial Population, Demographic Parameters, and Harvest tabs to familiarize yourself with this Scenario’s inputs. By default, the harvest is specified as a number of individuals harvested per year (although it can also be specified as a rate using the Options menu on the left). Between 2018 and 2022 the harvest is at 100 females and 100 males per year; from 2023 onwards the harvest is set at 50 females and 200 males per year.
Next, open the Scenario Properties window for the 4x Harvest Scenario. Review the Properties tabs for this Scenario; you will notice that the model inputs within the Harvest tab contains Annual Harvest values per year that are 4 times greater than those of the Baseline Scenario.
Close the Scenario Properties windows you have open. You are now ready to do your first run of the model.
Step 4: Run the model
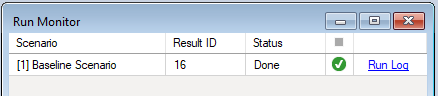
Right-click on the Baseline Scenario in the Scenario Manager window and select Run from the context menu. If prompted to save your project click Yes. The run should complete quickly. If the run is successful you will see a Status of Done in the Run Monitor window, at which point you can close the Run Monitor window; otherwise click on the Run Log link to see a report of any problems, make any necessary changes to your Scenario, and then re-run the Scenario.
Run the 4x Harvest Scenario next by repeating the steps above.
Step 5: Analyze the results
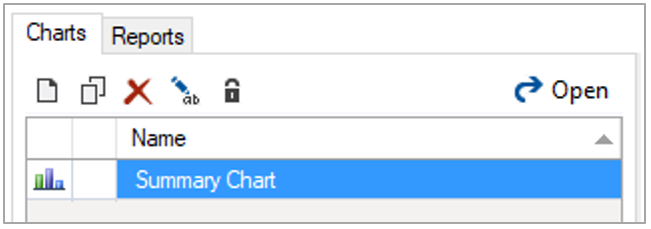
To view results for your run, move to the Charts tab at the bottom left of the Scenario Manager screen and double-click on the Summary Chart to open it.
You can now view and compare the results of running your two Scenarios through the model from the DG-Sim Package.
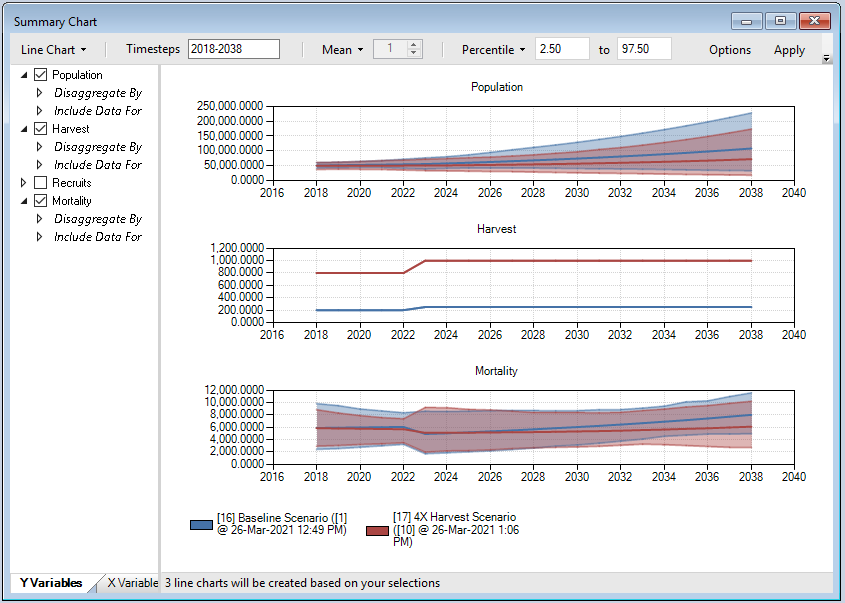
Note that, due to the uncertainty in Mortality rates, there is a lot of variation between Monte Carlo iterations in the Population projections. However, because there was no uncertainty specified for future Harvest levels, the projections for Harvest are the same across all iterations.
Next, select the Reports tab from the bottom of the Scenario Manager window (i.e. beside the Charts tab). Double click on Population Size Summary to generate a file with the model population projections (in either Excel or CSV format). By default an Excel file should open automatically (look for it on your Windows Task Bar) showing the projected number of individuals in each age/sex class by iteration and timestep.
Note: You can add and remove Results Scenarios from the list of scenarios being analyzed by selecting a Scenario in the Library Explorer and then choosing either Add to Results or Remove from Results from the Scenario menu. Scenarios currently selected for analysis are highlighted in bold in the Library Explorer.