Getting started with Epi
Quickstart Tutorial: a COVID-19 model example
This quickstart tutorial will introduce you to the basics of working with Epi. The steps include:
- Installing Epi
- Creating a new Epi Library
- Viewing model inputs and outputs
- Running the model
Step 1: Install Epi
Epi is a Package within the Syncrosim simulation modeling framework; as such, Epi requires that the SyncroSim software be installed on your computer. Download and install the latest version of SyncroSim here. If you choose to run Epi, you will also need to install R version 4.0.0 or higher, and the Epi add-on package, epiModelVocVaccine.
Note: The Epi package includes a template Library, covid19-example.ssim, that contains example inputs and outputs. Installation of R and the add-on epiModelVocVaccine package is not required to view the template Library.
Once all required programs are installed, open SyncroSim, select File -> Packages… -> Install…, select the epi package and click OK.
Step 2: Create a new Epi Library
Having installed the Epi Package, you are now ready to create your first SyncroSim Library. A Library is a file (with extension .ssim) that contains all of your model inputs and outputs. The format of each Library is specific to the Package for which it was initially created. To create a new Library, choose New Library… from the File menu.
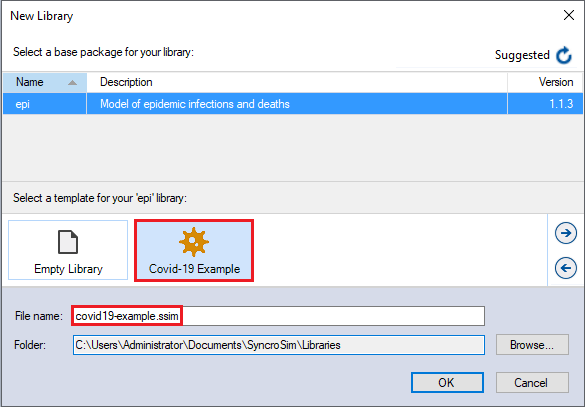
In this window:
- Select the row for epi. Note that as you select a row, the list of Templates available and suggested File name for that base package are updated.
- Select the Covid-19 Example Template.
- Optionally type in a new File name for the Library (or accept the default); you can also change the target Folder using the Browse… button.
When you are ready to create the Library file, click OK. A new Library will be created and loaded into the Library Explorer.
Step 3: View model inputs and outputs
The contents of your newly created Library are now displayed in the Library Explorer. Model inputs in SyncroSim are organized into Scenarios, where each Scenario consists of a suite of values, one for each of the Model’s required inputs.
Because you chose the Epi template when you created your Library, your Library already contains three scenarios:
- 1: Data
- 2: Forecast - Status Quo
-
3: Forecast - Additional Vaccines
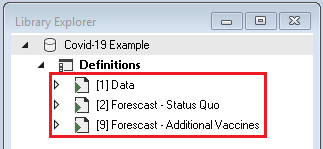
The Data Scenario contains the input data, which are COVID-19 cases data. These data are then fed into the two forecast Scenarios, Forecast - Status Quo and Forecast - Additional Vaccines, which each contain model parameters for forecasting future cases. - In the Library Explorer, select the Scenario named Data
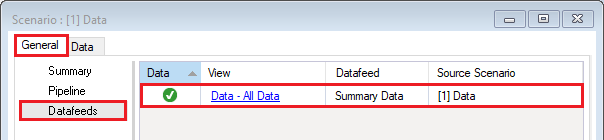
- Right-click on the Scenario and Choose Properties from the drop-down menu to vew the details of the Scenario
This opens the Scenario Properties window. The Datafeeds datasheet displays a list of all data sources for the Scenario. In this case, there is only one data source, the Data - All Data datasheet.
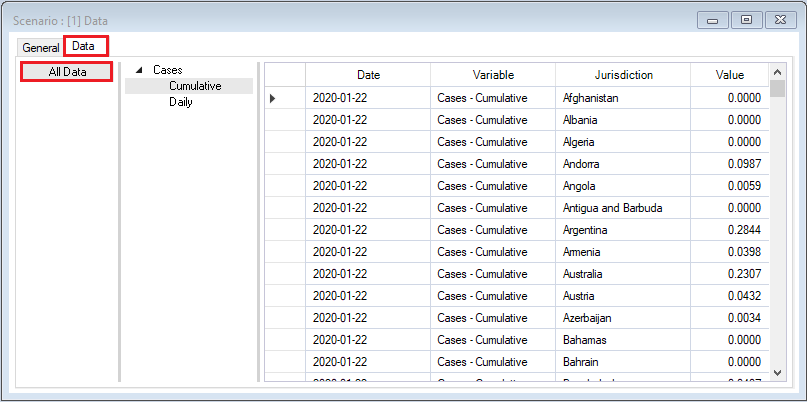
The Data - All Data datasheet contains data of daily and cumulative COVID-19 cases for 195 countries from 2020-01-22 to 2021-06-29. These data were downloaded from the Johns Hopkins University COVID-19 Data Repository and have been smoothed to remove seasonal effects.
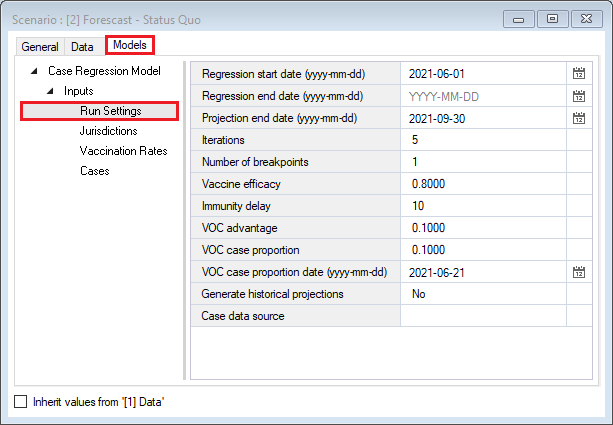
Open the Forecast - Status Quo Scenario. Click on the Models tab and navigate to Run Settings under the Inputs drop-down. This is where parameters for the VOC + Vaccine Model: Run Model are defined.
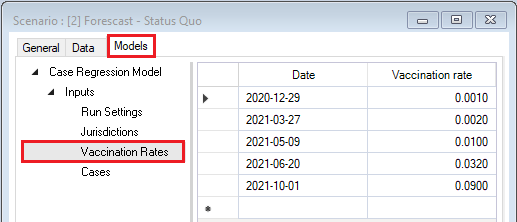
Further down in the Inputs drop-down menu is the datasheet, Vaccination Rates. This datasheet contains historic rates of vaccination beginning in 2020-12-29, as well as current and future rates.
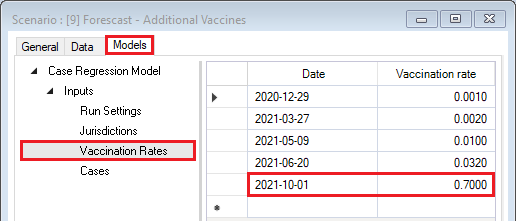
Open the Forecast - Additional Vaccines Scenario and explore the datasheets available in each tab. You will notice that this Scenario is identical the Forecast - Status Quo Scenario, except for the vaccination rate for the date 2021-10-01. This Scenario will forecast future COVID-19 cases given higher rates of vaccination compared to lower vaccination rates under a status-quo scenario.
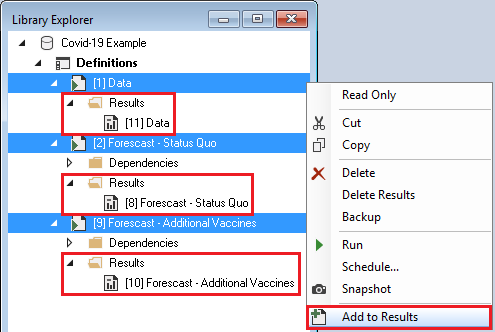
Each of these three Scenarios have already been run and contain model outputs in corresponding Results Scenarios, which can be found under the drop-down menu of each Scenario in the Results folder. These Results Scenarios were generated by selecting individual Scenarios and clicking the green Run Scenario button in the SyncroSim tool bar. We will view these results next using the Charts window.
- Select each Scenario, either individually or all together by selecting the first Scenario, holding the Shift key on your keyboard, and selecting the last.
- Right-click on the selected Scenarios and click on the Add to Results option from the drop-down menu.
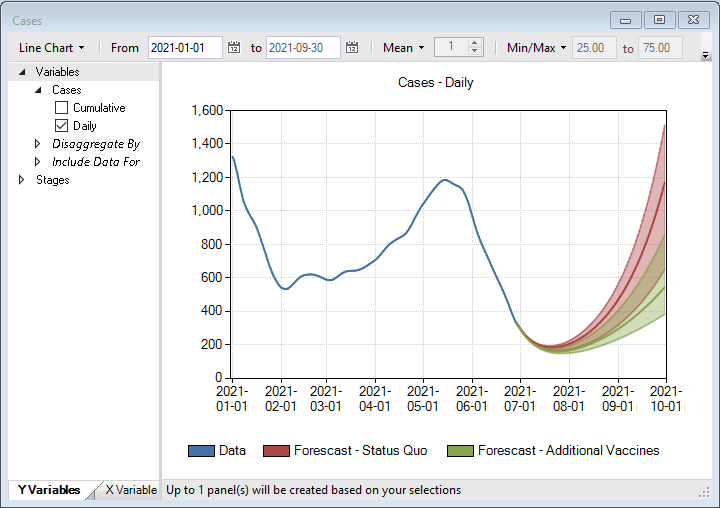
This adds model outputs from the selected Results Scenarios to the Cases Chart in the window below the Library Explorer. Double click on the Cases Chart to view the daily cases data and forecasts under the two alternative vaccination scenarios.
Step 4: Running the model
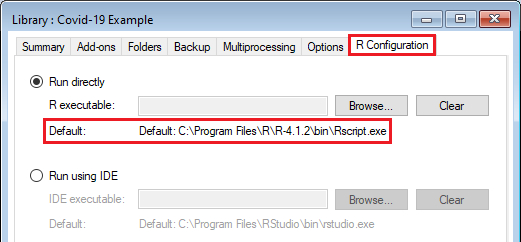
In order to run the model, SyncroSim needs the file path of your R executable. To verify the Default file path, double-click on the Covid-19 Example Library and navigate to the R Configuration tab. To override the Default file path, click Browse… and navigate to the correct file location.
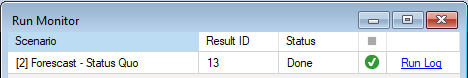
Once your Covid-19 Example Library is configured, you can run the model by right-clicking on the Forecast - Status Quo Scenario and selecting Run from the context menu. If prompted to save your project, click Yes. If the run is successful, you will see a Status of Done in the Run Monitor window, at which point you can close the Run Monitor window; otherwise, click on the Run Log link to see a report of any problems. Make any necessary changes to your Scenario, then re-run the Scenario.
Repeat the steps above to run the Forecast - Additional Vaccines Scenario.