Getting started with Enhanced Helloworld
⚠️ Notice to Users
The Getting Started documentation and associated Tutorials for this SyncroSim package currently reflects information for SyncroSim version 2. We are in the process of updating these pages to ensure compatibility with SyncroSim version 3. In the meantime, please note that some instructions, references, and/or images may not fully align with the latest version of SyncroSim. We appreciate your patience as we work to provide updated resources.
Quickstart Tutorial
-
Download and install the latest version of SyncroSim from https://syncrosim.com/download/.
- Install the helloworldSpatial package in the SyncroSim user interface by selecting File | Packages | Install…
- If you need to update package versions, in SyncroSim go to File | Packages | Update…
- Create a new helloworldSpatial Library
- In SyncroSim, select File | New Library…
- Select the helloworldSpatial base package and choose the Empty Library template.
- Enter a Filename (ok to keep the default) and a Folder for your new Library, then click OK.
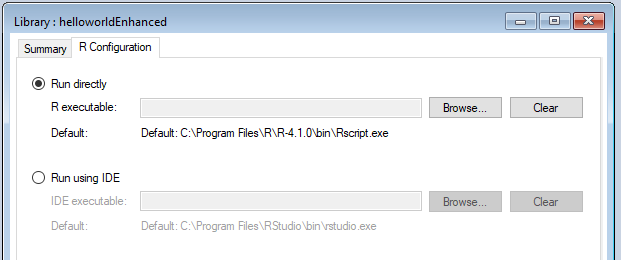
- First, check your executable location by clicking on the helloworldSpatial Library in the Library Explorer, and then selecting Library Properties from the File menu. Select the R Configuration tab to check and/or set the location of your R program executable.
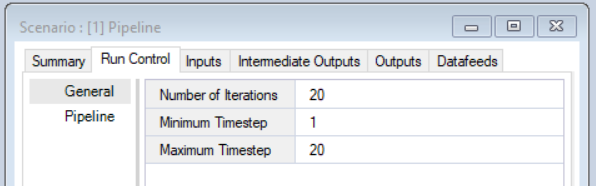
- To set the number of time steps and iterations, right-click on the auto-generated empty New Scenario in the Library Explorer and select Properties. Then select the Run Control - General tab. Fill in the Number of Iterations, the Minimum Timestep, and the Maximum Timestep.
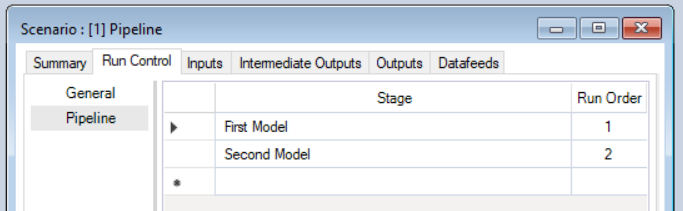
- To use a Pipeline in your scenario, still within Properties, navigate to the Run Control - Pipeline tab. Set the model named First Model to run first, and the model named Second Model to run second.
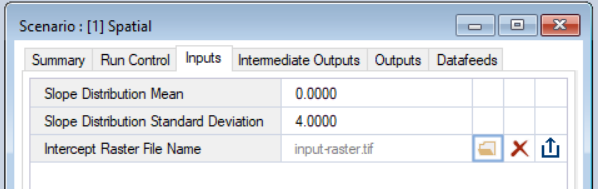
- To edit the Scenario inputs, still within Properties, navigate to the Inputs tab and enter values for your mMean, mSD, and Intercept Raster File Name model inputs in the grid.
- To run the Scenario, right-click on this New Scenario again in the Library Explorer and select Run.
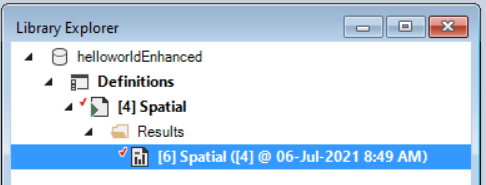
- Once the run is complete, return to the Library Explorer. Expand the node beside the New Scenario to reveal a Results folder containing your results, then expand the node beside the Results folder to show the newly generated date/time stamped Results Scenario. Each Results Scenario contains a read-only snapshot copy of all your inputs at the time of your run, along with values for your model generated outputs.
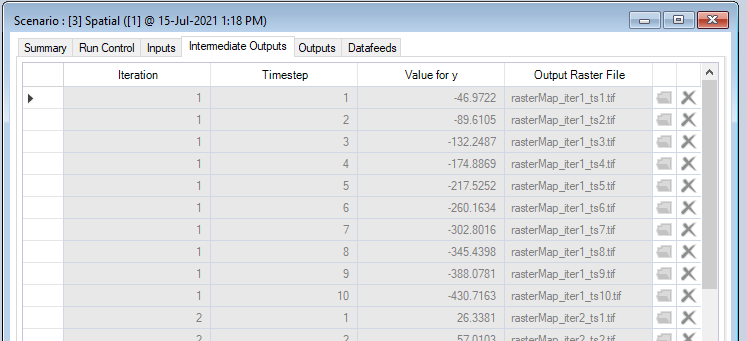
- Right-click on this Results Scenario and select Properties to view the details of this Results Scenario; you will find your calculated outputs under the Intermediate Outputs and Outputs tabs.
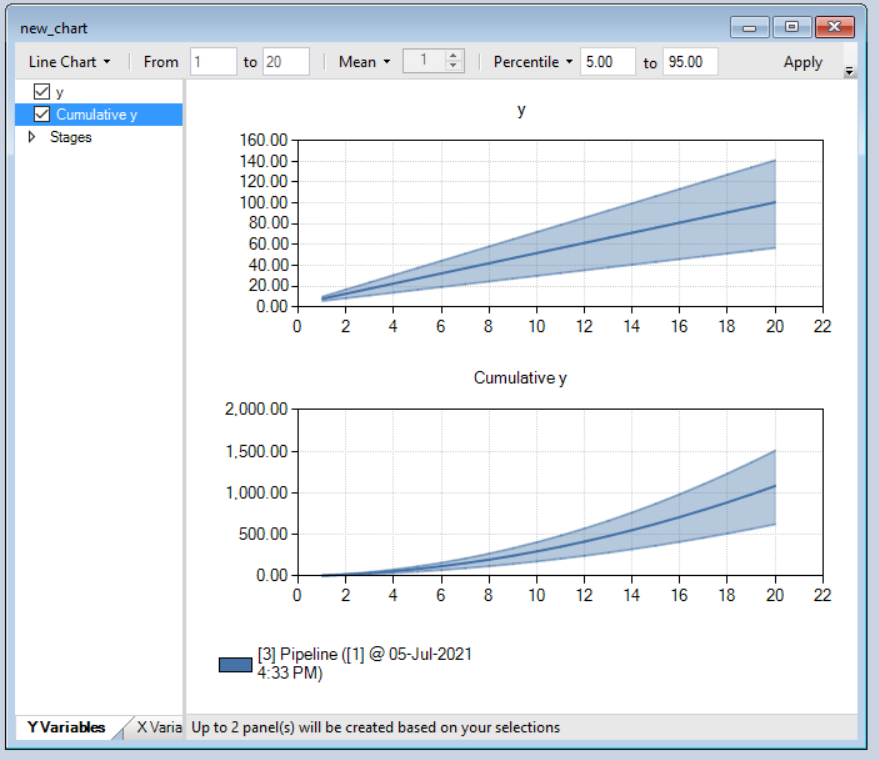
- To view charts of the results from each model in the pipeline, select the Create a new chart button in the Results Viewer. Select both y and/ Cumulative y from the left-hand column. Click Apply
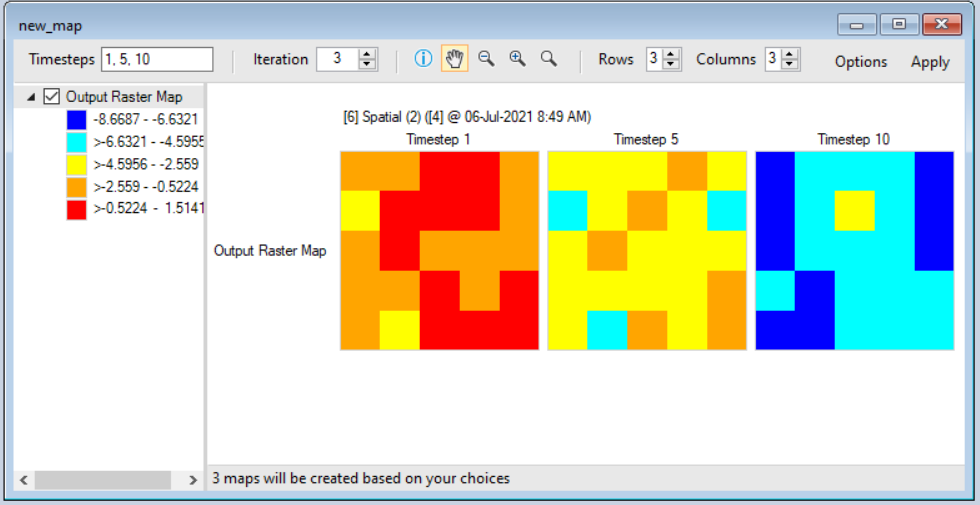
- To view maps of the results from the spatial model, click on the Maps tab in the Results Viewer, and click Create a new map. Select Output Raster Map from the left-hand side. Click Apply to view the map of the last timestep for the first iteration. You can change the Timesteps or Iteration by modifying the values in the top toolbar.
For the complete tutorial on how to create the Enhanced Helloworld Packages, see the enhancing a package tutorial in the SyncroSim documentation.